 AISOLUTIONS
A daily operating view
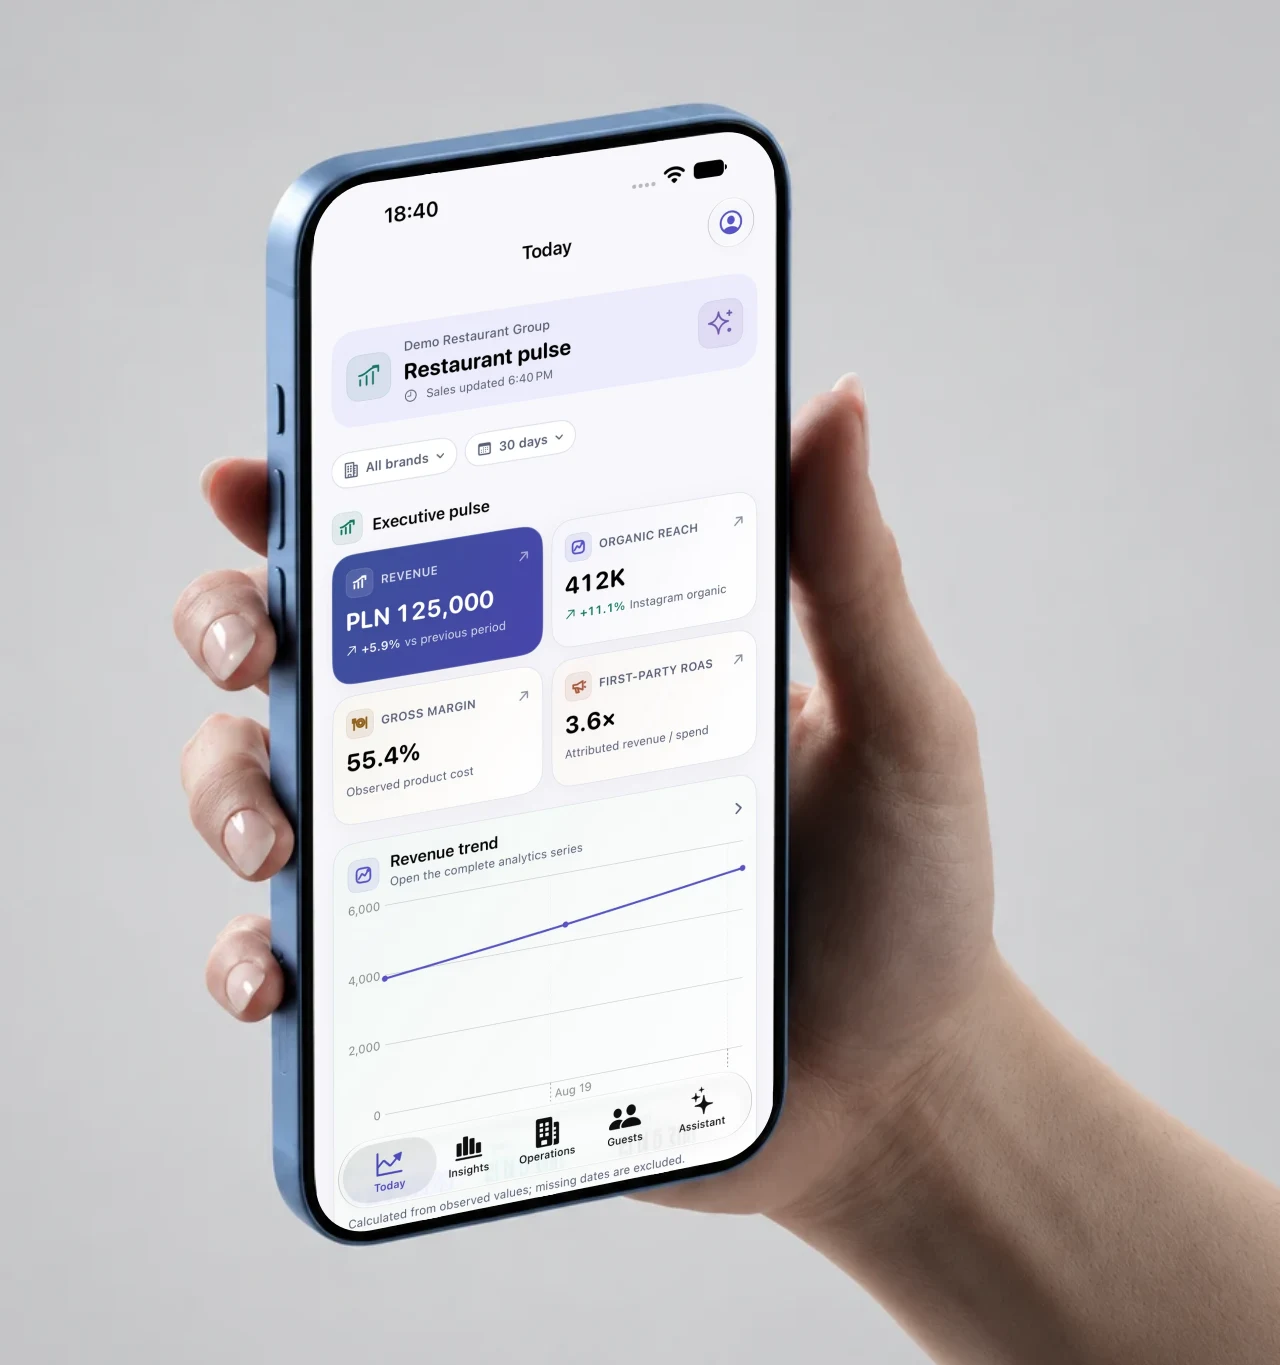
Revenue, bookings, performance indicators and comparisons help focus attention on meaningful changes.
 Planerix REST
Restaurants & hospitality
Restaurant intelligence that brings together performance, guests, bookings, team activity and everyday decisions.
The business
Restaurant owners need to understand revenue, demand and guest relationships while keeping up with the operation. That picture is difficult to assemble from disconnected sales, booking and social tools.
Give owners and managers a focused view of their location and their role. Link available operational sources to comparable trends, guest profiles and an assistant that can explain the underlying data.
Multi-Location CRM & Analytics / Planerix REST
Restaurant teams need to connect location performance with guest conversations and follow-up work across web and mobile.
Combine restaurant performance, guest context and communications without mixing brands, locations or incomparable source data.
Guestlinked eventsReservation / OrderEventatBrand / LocationMetricsource / periodObservationBrand and location permissions are applied before building the event graph. Aggregate access does not automatically grant guest access.
Metrics retain period, currency and source coverage. Menu intelligence keeps unknown costs visible; staff indicators stay separate from payroll. HR programs support review, assignment, lessons, server-scored tests and stored progress.
Instagram Direct, comments and mentions retain source context in the inbox and Guest 360. AI manager assist analyzes intent and prepares reply suggestions; staff review and provider readiness govern sending.
Analytics and Guest 360 share restaurant context but have separate access boundaries. The native inbox keeps channel and guest context together; AI proposes a response for staff review.
Brand/location scope is applied before graph construction. Metrics retain period, currency and coverage; contact matches remain candidates until verified. Sending depends on provider permissions and delivery readiness.
Native owner analytics, inbox, Instagram thread and Guest 360 screens use synthetic records. Connector, manager-assist and outbox contracts explain the path from intake to a reviewed reply.
Direct, comments, mentions and tagged content connect to conversation history and Guest 360. AI summarizes the request, suggests profile matches and drafts replies for staff review. Available channels depend on account permissions and activation.
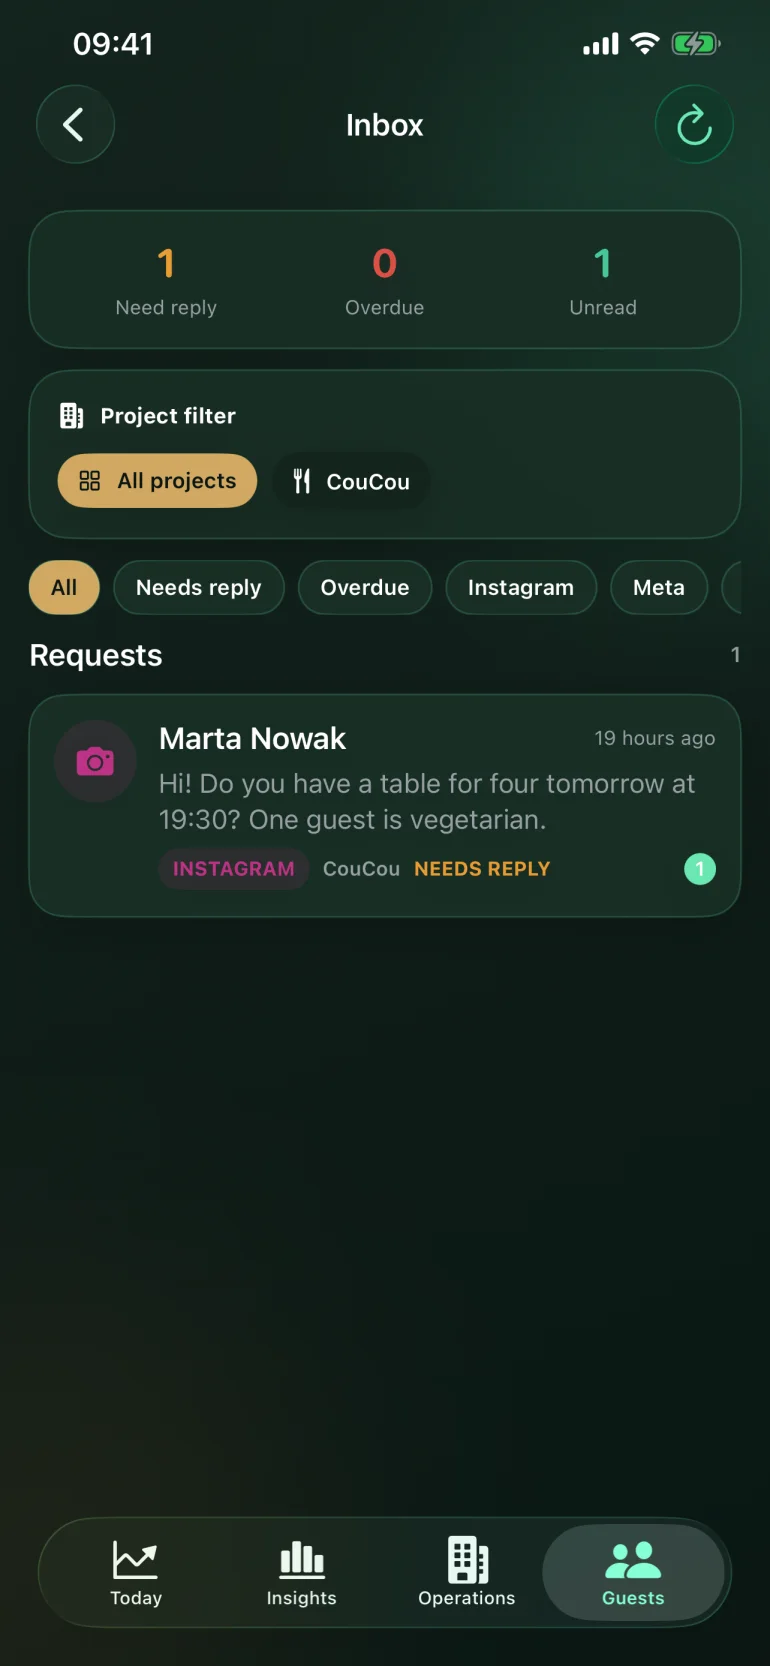
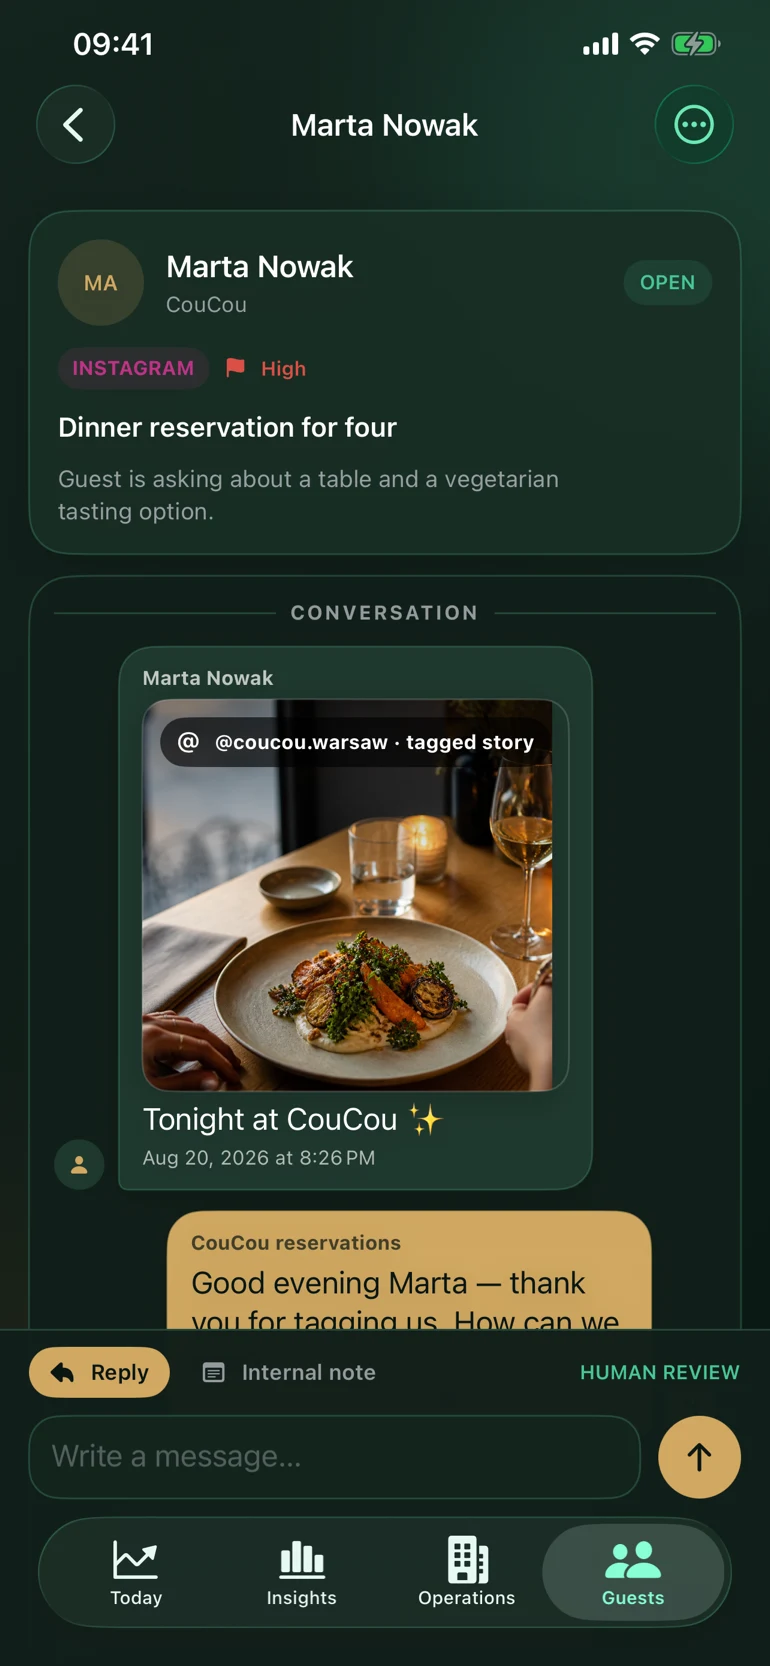
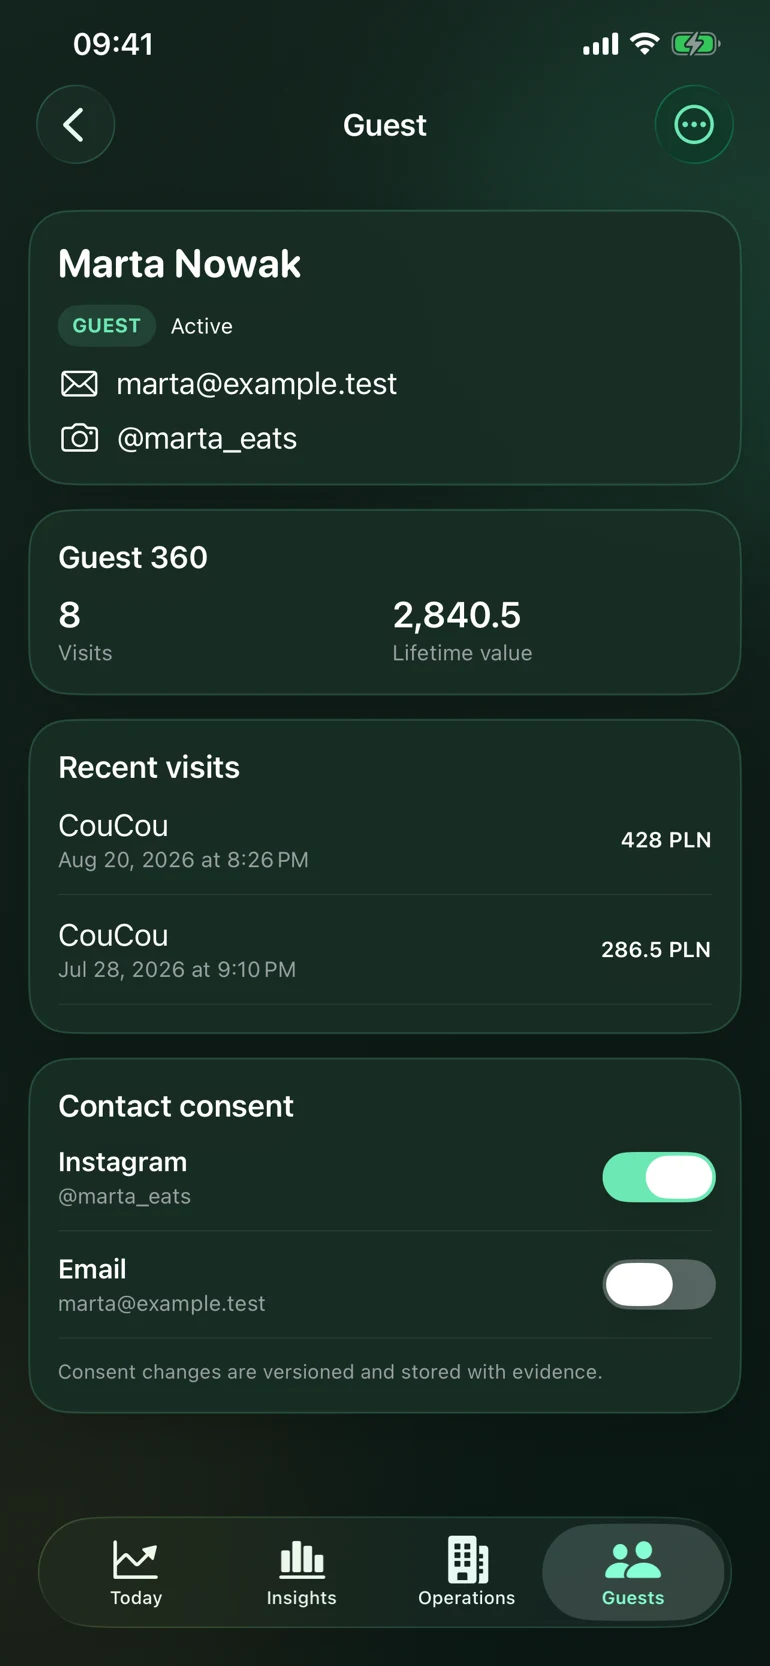
A restaurant workspace connects guest communications and Guest 360 with bookings, reviews, influencers, electronic menus, menu/staff analytics and HR learning. Available channels follow provider permissions.
Founder & Product Architect · business model, system design, web and iOS
The delivered platform supports client-branded configurations. Each rollout has its own source coverage, permissions and support scope; no conversion uplift is claimed.
A workflow in practice
An owner spots a change, compares periods and asks the assistant to explain it. Guest history and operational detail are a step away.
Start with revenue, bookings and the indicators for the selected period.
Explore trends and rankings to understand where performance changed.
Ask the assistant a question and follow the supporting analytics.
Open the relevant guest, booking or operating area for more context.
What this makes possibleThe overview, explanation and supporting records sit within one owner and manager experience.
Extend the pattern to multi-location services, hospitality groups and customer-facing businesses.
Build on this pattern02 / Inside the system
Revenue, bookings, performance indicators and comparisons help focus attention on meaningful changes.
Guest profiles bring together linked reservations, conversations and interaction history from available sources.
Explore guests, menu items and team performance with period comparisons and clear detail views.
Ask questions in natural language and follow source links to understand the answer.
03 / Product in focus
Open a screen to take a closer look.
Actual product interfaces, shown with demonstration data or existing public marketing content.
The connected ecosystem
Bring familiar software into the way you run your business. Connections are set up around your workflows.

Direct messages, replies and conversation context

Advertising across Facebook and Instagram

Campaign performance

Audience & acquisition

Reservations & guest records

Restaurant POS
Tailored connection
POS & payments
Tailored connectionTailored connections are scoped for your business before setup.
Discuss your softwareProduct names and logos belong to their respective owners.